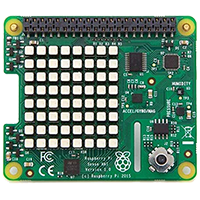
Vital_Signs uses a Sense HAT's LEDs to display columns of:
- The combined load % across all CPU cores, or
- Each core's load %.
- Memory available/unavailable
- CPU temperature (C or F)
- Sense HAT's temperature (C or F)
- Sense HAT's % humidity
Vital_Signs optionally displays ping results as OK/fail for up to 8 computers.
The data is organized by column. The Sense HAT's LED array is organized by row. The least-complicated programming methodology is to map columns to the LED array's rows. The first row at the top becomes the left column.
The terms "LED" and "pixel" are used interchangeably. In most cases LED is used when referencing hardware and pixel is used for arrays. #
The columns appear 90 degrees clockwise from the rows. To see the columns in the row's orientation the columns' LED array is rotated -90 (270) degrees.
I went overkill on features, the interface is way to busy. I did this to hone my programming skills in Python, Raspbian, the Python IDE, and the Sense HAT.
The Ping Hosts feature runs as an independent thread on its own update schedule. That way if it gets delayed waiting for responses the
main display will update on schedule. The main thread displays the ping results regardless of how far through its cycle the Ping Hosts thread is.
The Apple logo is displayed because "I'm a Mac". My Raspberry Pi's run headless (without a display, mouse, or keyboard). I control them using VNC Viewer on my Mac.
Details are in the script's comments.


